- Published on
Spidey DB: Graph Database in C
Spidey DB explores graph-database ideas in C as a toy project. The project borrows a Redis-style command protocol and applies it to graph operations. It speaks RESP over TCP, so redis-cli can drive it from the terminal, and a small SvelteKit + D3 viewer sits alongside it and lets me inspect the graph in a browser.
The project has three parts:
- adjacency-list storage in C
- RESP command handling over sockets
- a TypeScript client and D3 viewer
The project gave me room to explore C data structures and sockets, then play with SvelteKit and D3 on the visualization side.
Graph model
Vertices live in a hash map, and each vertex points to a linked list of outgoing edges. That gives fast key lookup and straightforward neighbor traversal.
Example graph:
(a) <---> (b) <---> (c)

Adjacency list representation:
[a]: (b) -->
[b]: (a) --> (c) -->
[c]: (b) -->
Directed edges for this graph: a -> b, b -> a, b -> c, and c -> b. Edge order stays irrelevant for this workload, so inserts happen at the head of the list for O(1) writes.
SETEDGE treats links as bidirectional in this implementation, so setting a b writes both a -> b and b -> a.
This C implementation manages the backing hash table and memory lifecycle directly. C/HashTables helped shape that implementation.
RESP over TCP
I chose RESP for two reasons: it parses easily, and redis-cli can talk to it once COMMAND support exists. The server supports vertex operations, edge operations, full graph reads, and neighbor queries.
| command | description |
|---|---|
| GETVERTEX | retrieve the value of a vertex |
| SETVERTEX | set the value of a vertex |
| DELVERTEX | delete a vertex and associated edges |
| SETEDGE | set an edge between two vertices |
| DELEDGE | delete an edge between two vertices |
| GETGRAPH | retrieve the entire graph |
| GETNEIGHBORS | retrieve neighbors for a vertex within a distance |
I also implemented COMMAND because redis-cli requests it on connect.
On the networking side, the server handles connection lifecycle, request parsing, command dispatch, and response writes. Beej's Guide to Network Programming guided most of this part.
❯ redis-cli -p 6425
127.0.0.1:6425> SETVERTEX a-key a-value
OK
127.0.0.1:6425> SETVERTEX b-key b-value
OK
127.0.0.1:6425> SETEDGE a-key b-key
OK
127.0.0.1:6425> GETGRAPH
1) 1) "a-key"
   2) "b-key"
2) 1) 1) "a-key"
      2) "b-key"
   2) 1) "b-key"
      2) "a-key"
127.0.0.1:6425>
GETGRAPH returns two arrays: vertices first, then edges.
Neighbor queries
GETNEIGHBORS <root> <distance> runs BFS and returns only the reachable subgraph within that hop distance.
GETNEIGHBORS starts by placing the root vertex in a queue. Each iteration pops one vertex, marks it as visited, and enqueues neighboring vertices with their depth. Once a vertex reaches the requested distance, the traversal records it but does not enqueue its neighbors. After traversal, the server encodes the collected vertices and edges back to RESP.
❯ redis-cli -p 6425
127.0.0.1:6425> SETVERTEX a 1
OK
127.0.0.1:6425> SETVERTEX b 2
OK
127.0.0.1:6425> SETVERTEX c 3
OK
127.0.0.1:6425> SETEDGE a b
OK
127.0.0.1:6425> SETEDGE b c
OK
127.0.0.1:6425> GETNEIGHBORS a 1
1) 1) "a"
   2) "b"
2) 1) 1) "a"
      2) "b"
127.0.0.1:6425>
For (a) <---> (b) <---> (c), querying from a with distance 1 returns a and b, not c.
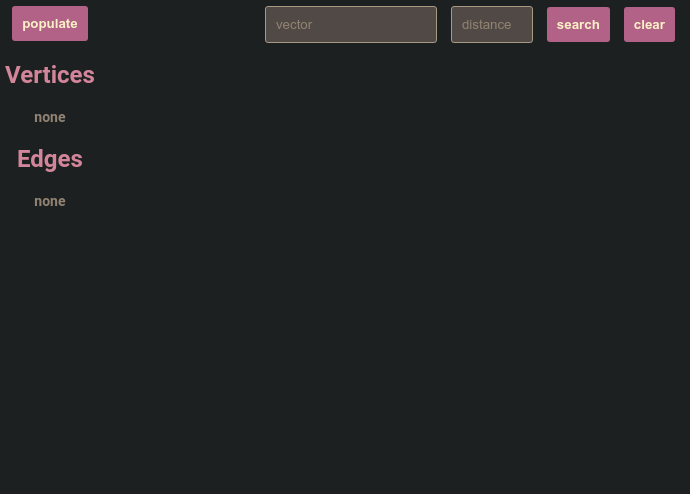
Browser viewer
The web side centered on experimenting with SvelteKit and D3. I reused RESP parsing and encoding logic from redis-ts in a TypeScript client for Spidey DB (source).
D3 force simulation handles layout, while Svelte components render nodes, edges, and interaction. Keeping simulation state in D3 and UI state in Svelte kept responsibilities clear.
Tradeoffs
C gives tight control over data layout and performance, but every feature needs more plumbing because C ships with no built-in map, queue, or graph structure.
SvelteKit + D3 provided a fast path to a usable viewer, but integration still took iteration around simulation state and component updates.
This project never aimed at production use. The work let me explore graphs in C, socket handling with RESP, and interactive visualization with D3 and SvelteKit.
Spidey DB: https://github.com/mattkubej/spidey-db
Spidey DB demo: https://github.com/mattkubej/spidey-db-demo